Overview
Census Demographic Analysis is an interactive mapping application designed to visualize demographic patterns across U.S. census block groups. It transforms complex geographic datasets into an accessible color-coded map that makes regional differences and changes easier to identify.
The application supports analysis across multiple demographic indicators, including population, race, median income, education, and age. Users can explore individual years or compare two periods to understand how selected indicators have changed over time.
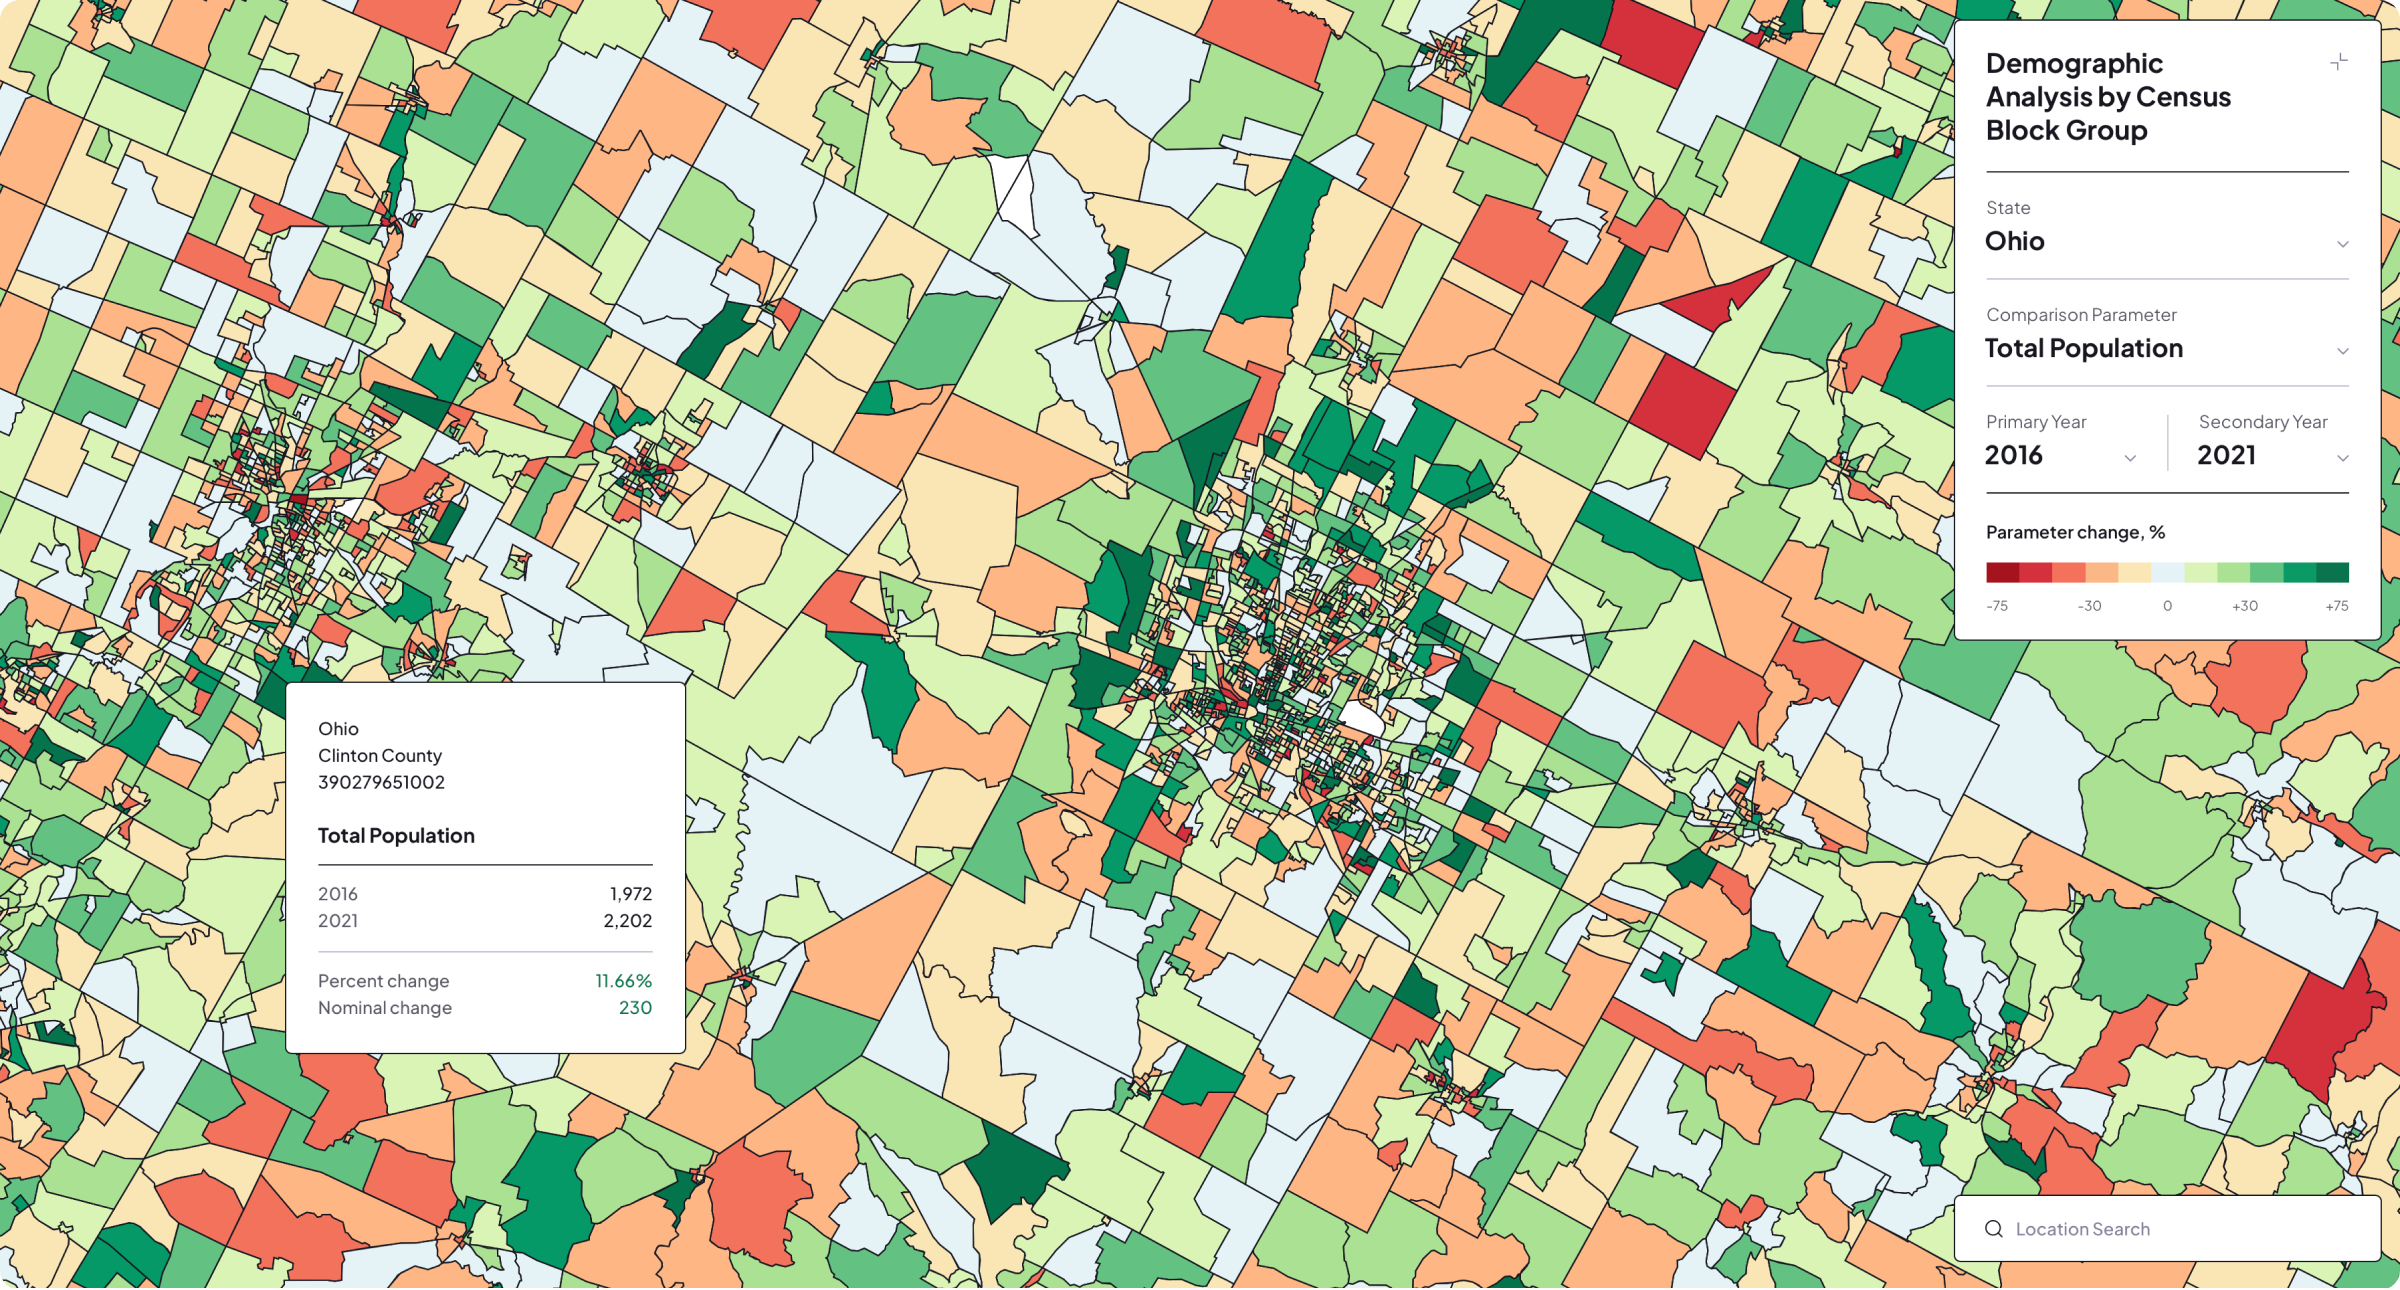
The application includes demographic data for Ohio and Texas, with optional county-level filtering and multiple years available for comparison. Interactive controls, location search, dynamic legends, and detailed map popups provide both a broad geographic overview and access to individual census block group values.
Core Challenges
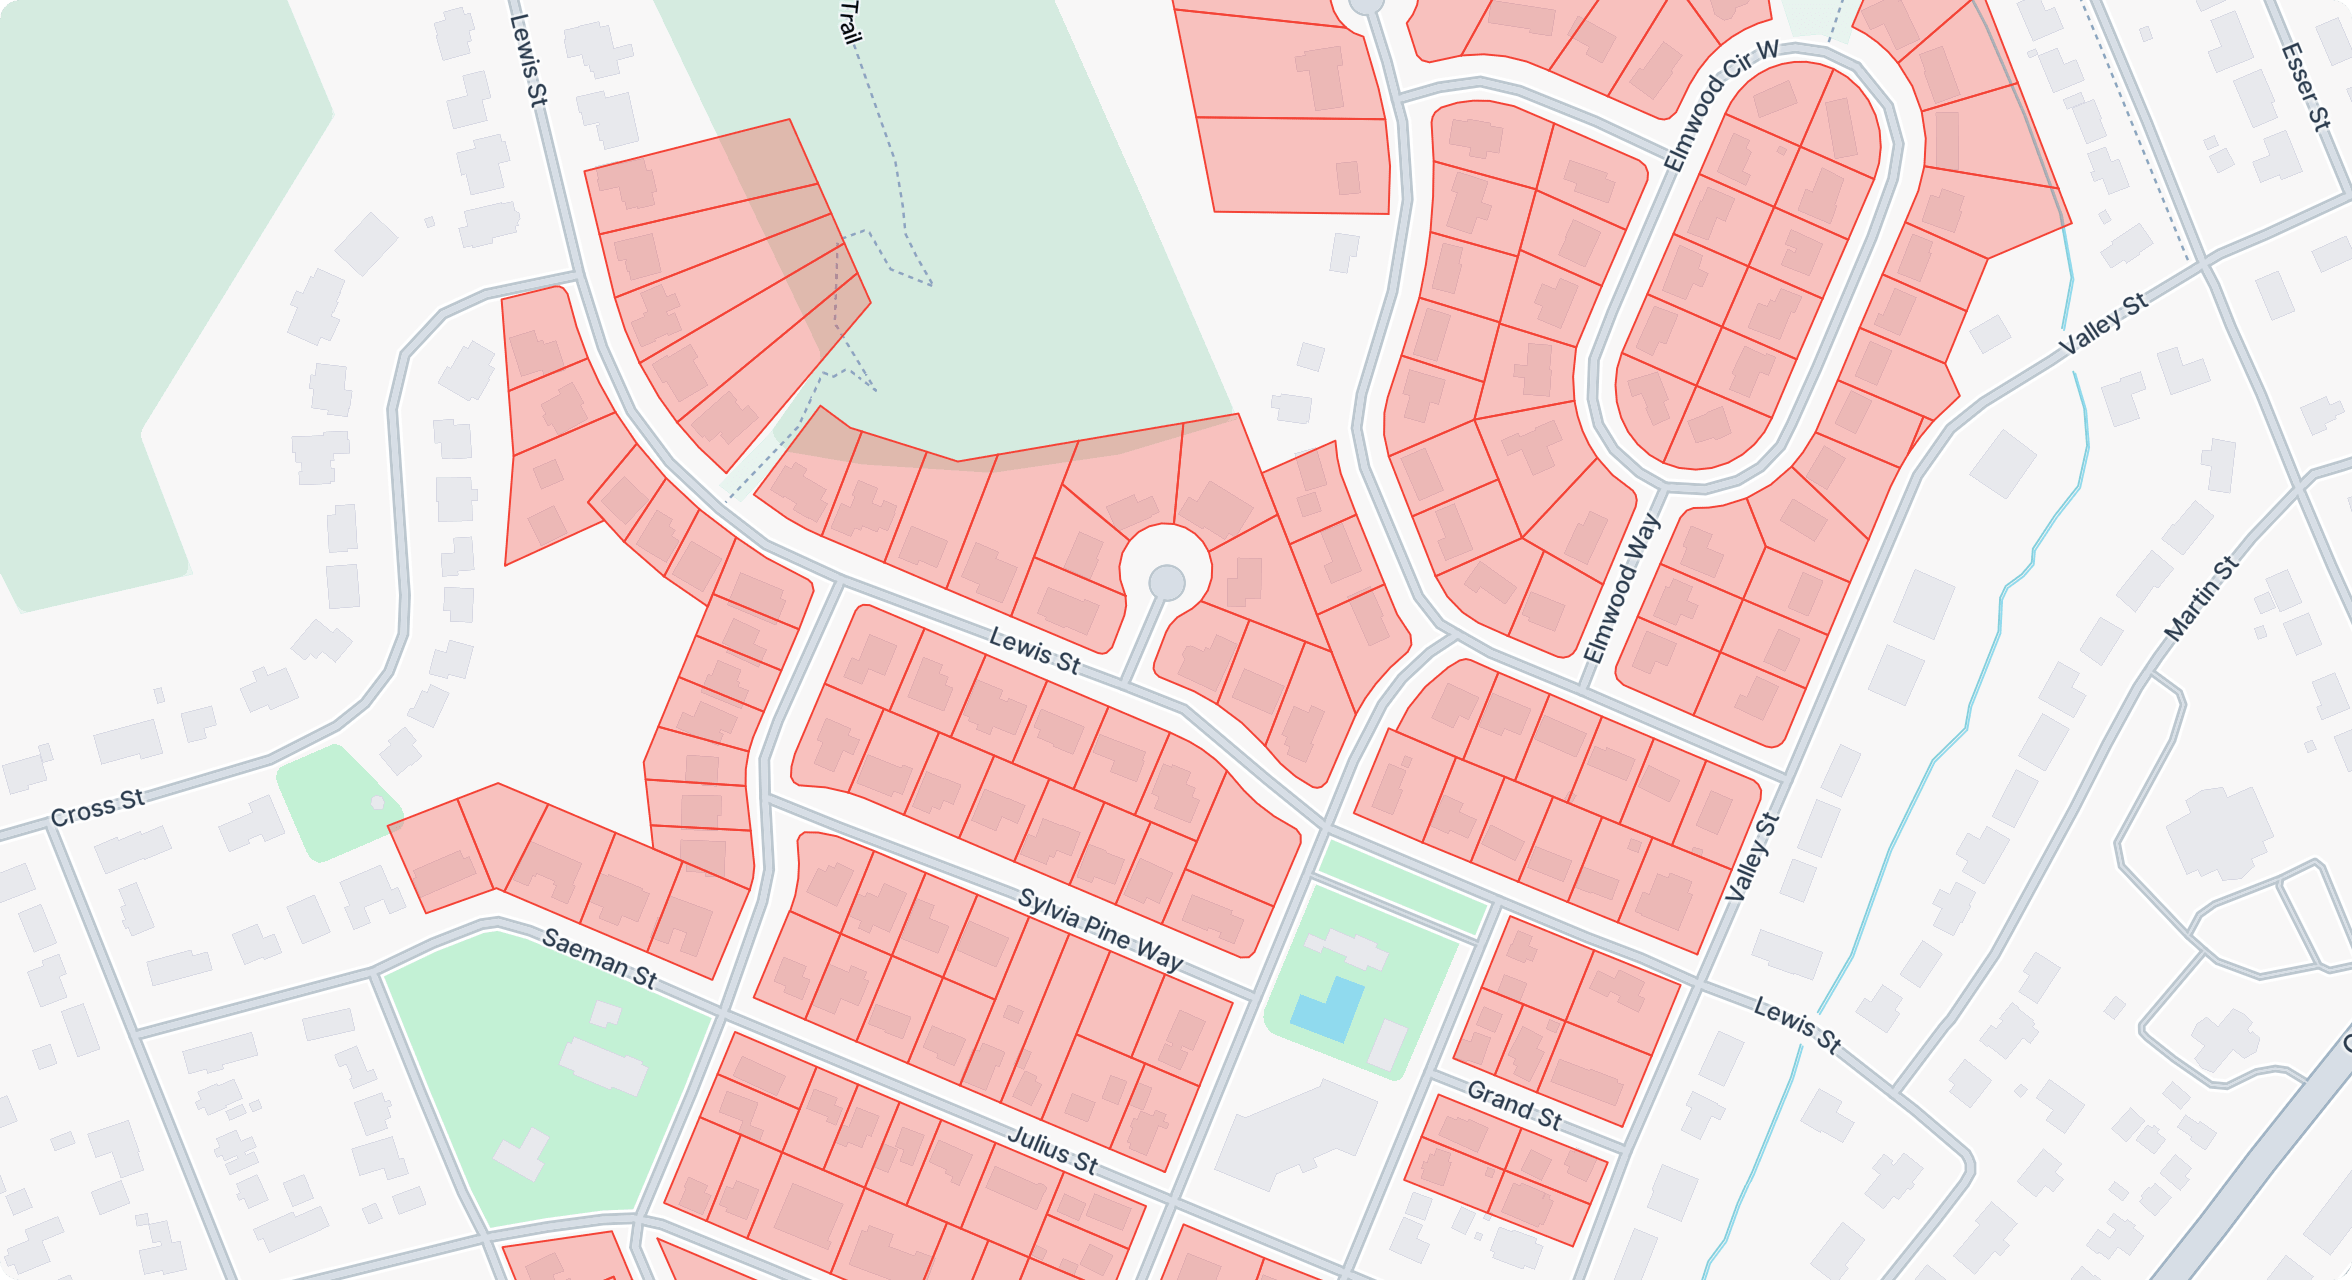
The central challenge was turning large, multidimensional census datasets into a clear geographic experience. Multiple indicators, years, counties, and thousands of block group geometries needed to be organized into a visual system that remained understandable without oversimplifying the underlying data.
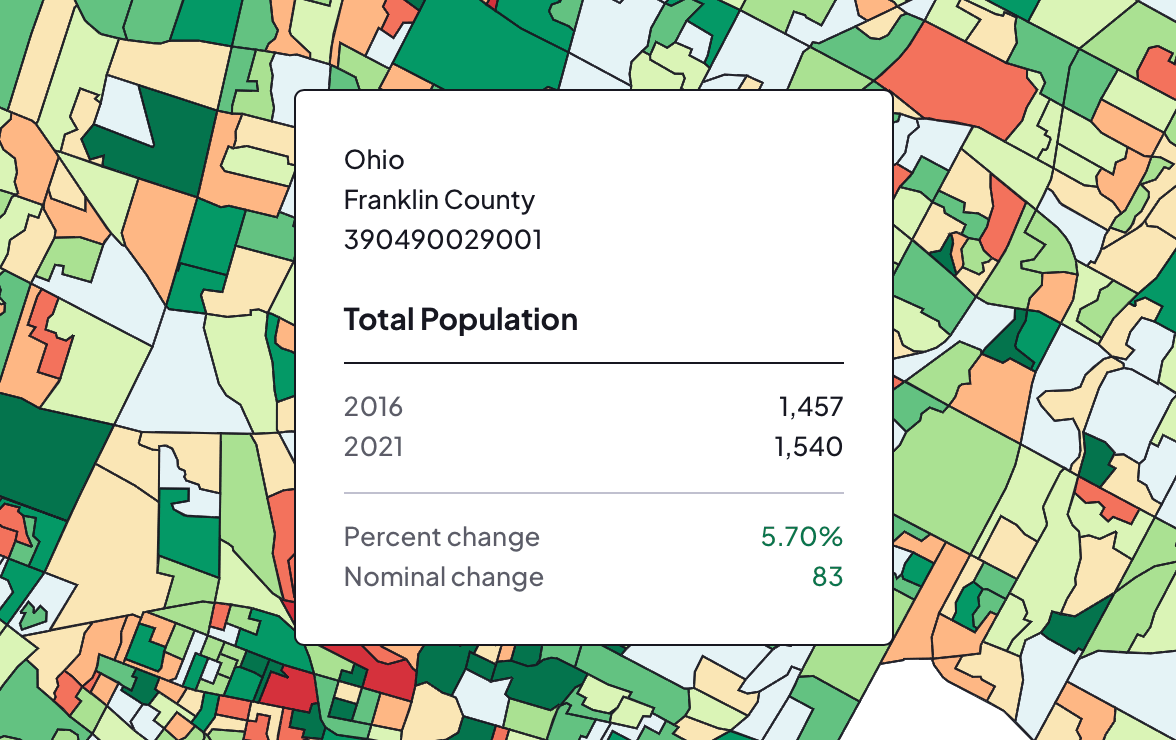
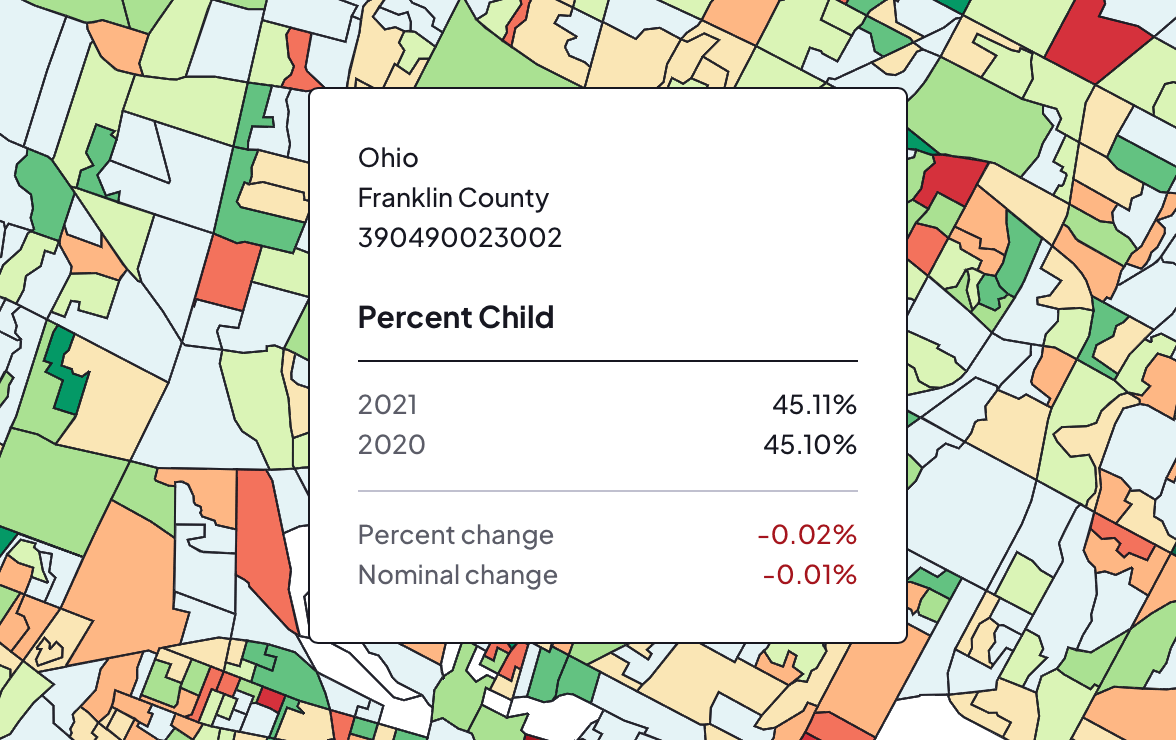
The application also needed to calculate and communicate change accurately. Absolute values, percentage-based indicators, nominal differences, and percentage changes require different formatting and color scales, while detailed polygon data must remain responsive during filtering, zooming, and map interaction.
The Solution
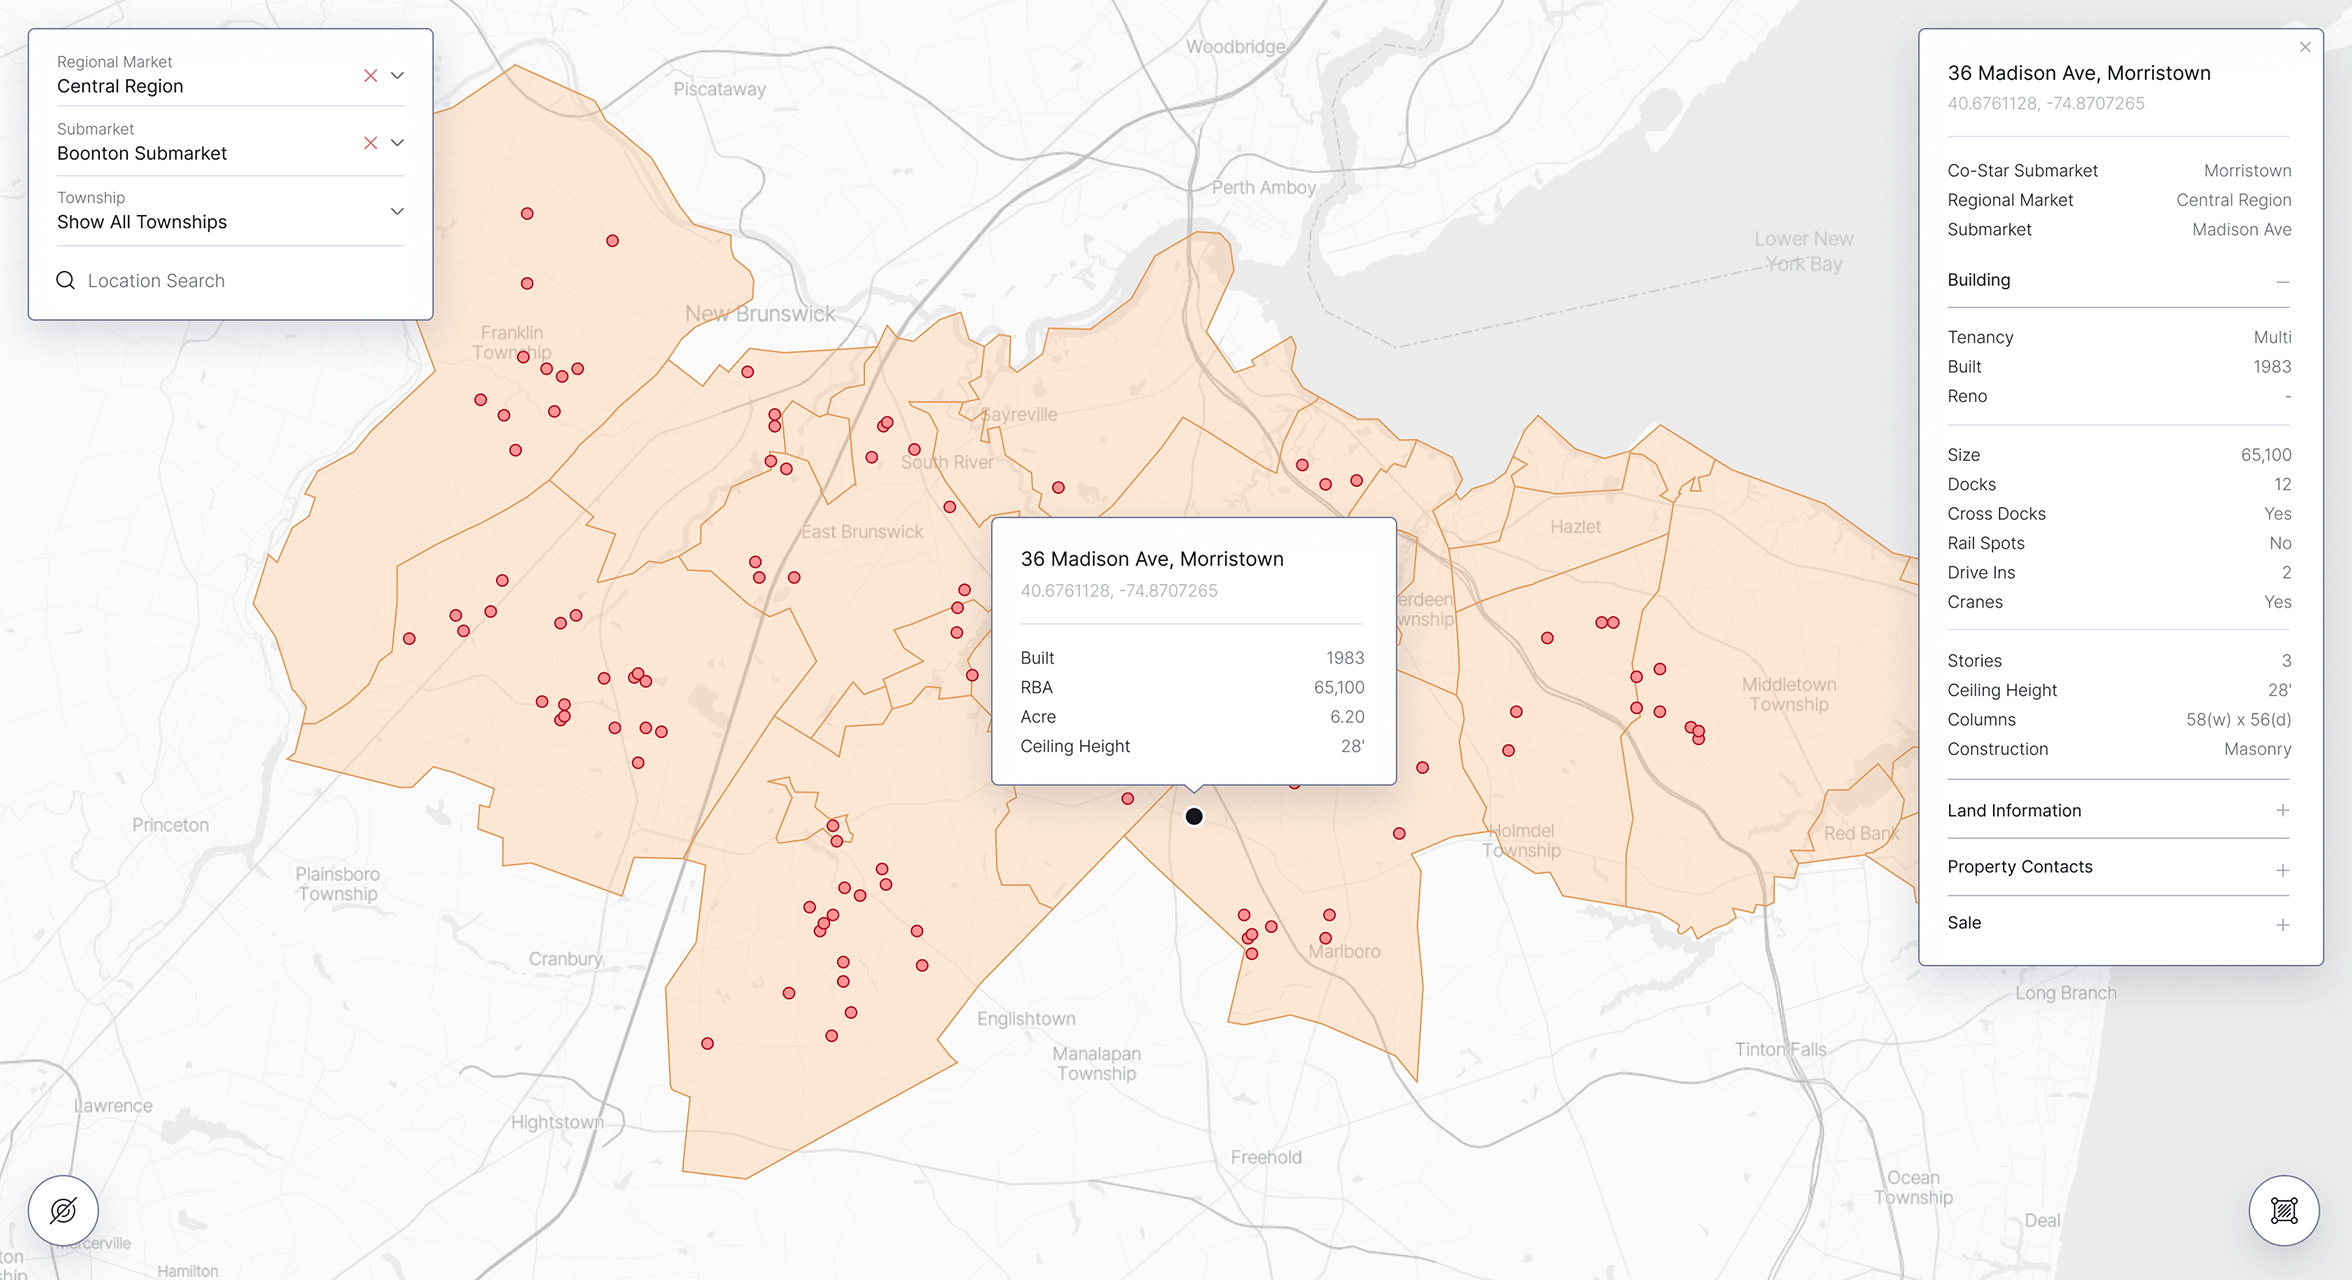
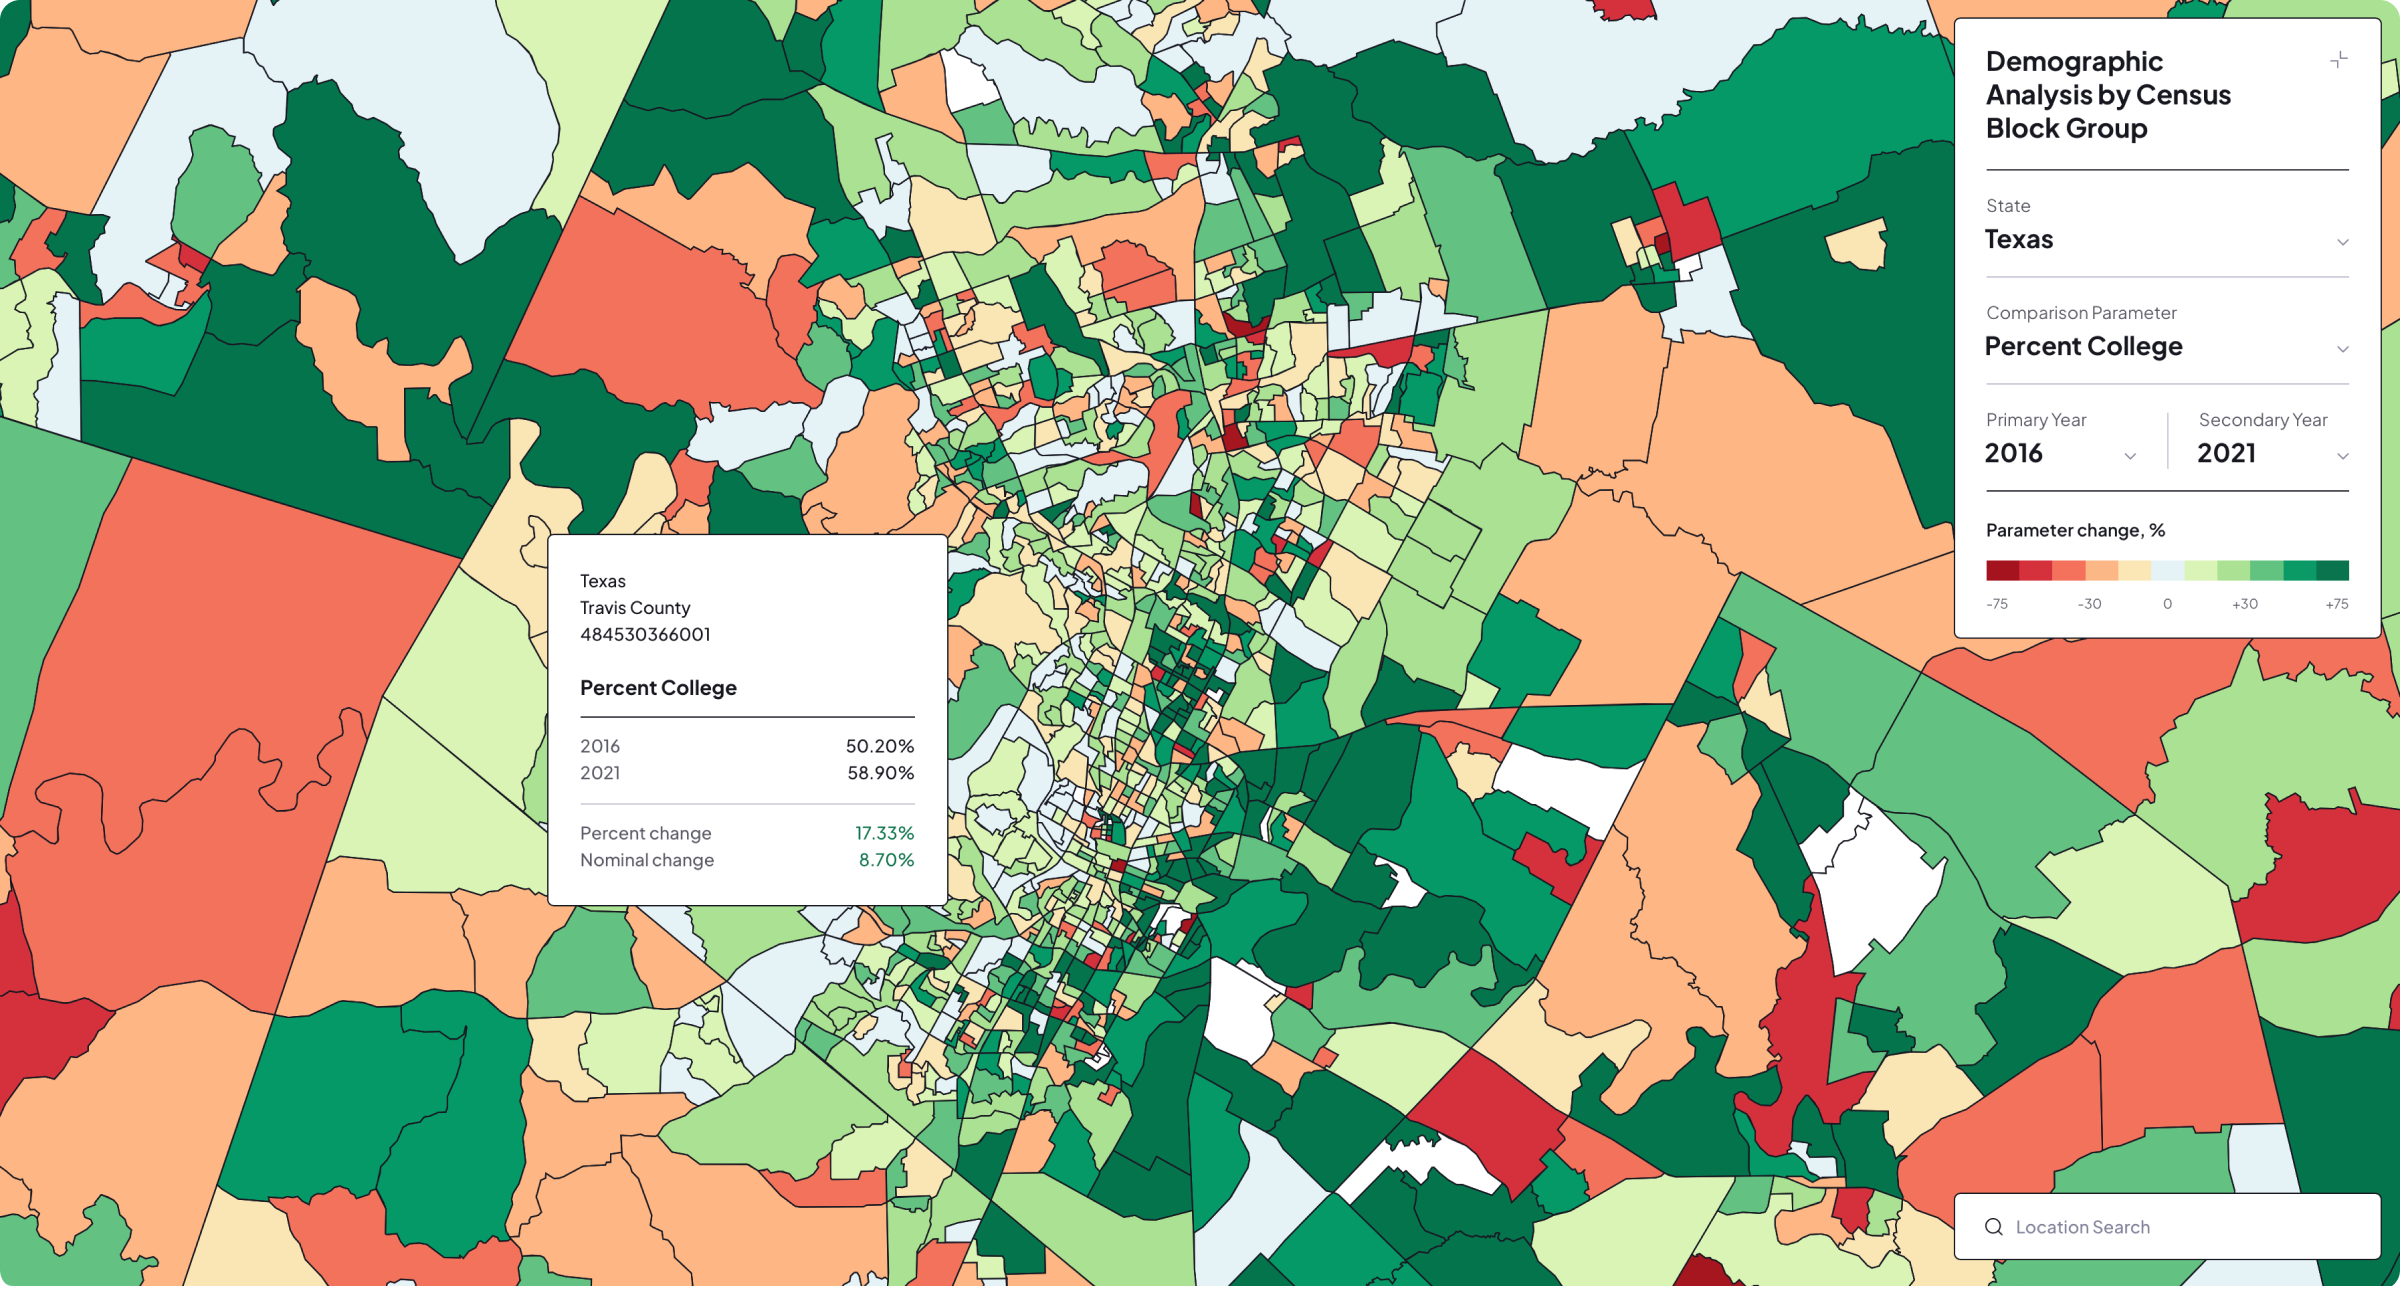
A custom choropleth mapping interface was built with Mapbox GL JS and GeoJSON. Users can select a state, filter counties, choose a demographic indicator, and switch between single-year distribution analysis and year-over-year comparison. The map automatically updates its layers, ranges, legend, and color scale for the selected data.
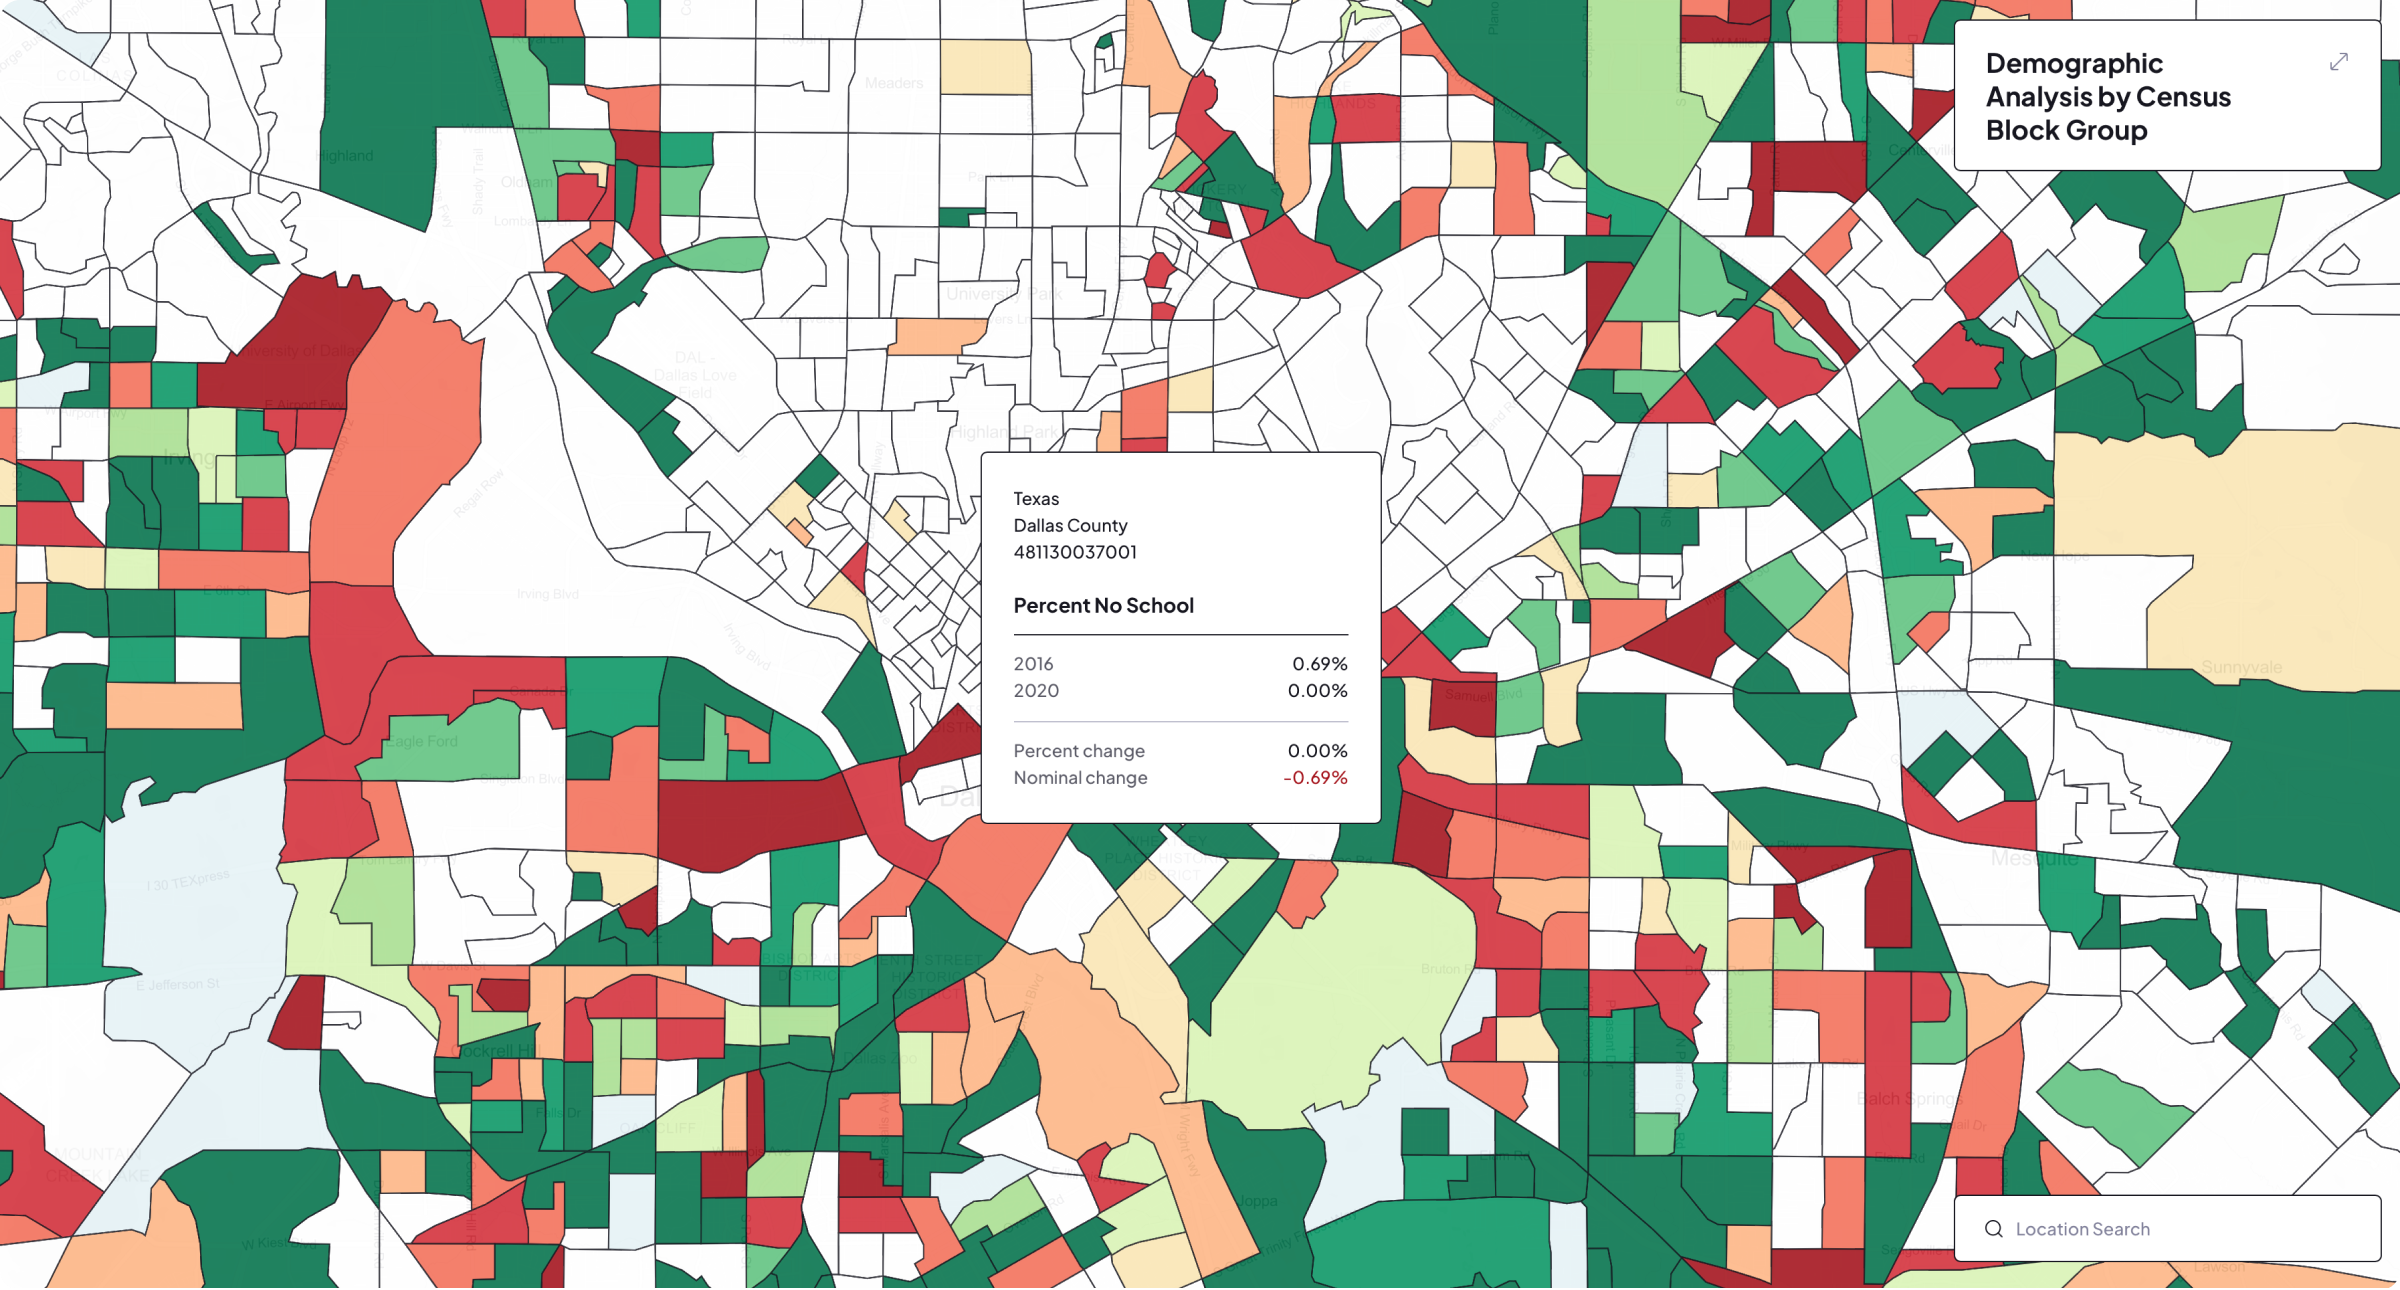
Interactive popups display the census block group identifier, county, values for each selected year, nominal change, and percentage change. Mapbox Geocoder provides location search, while a collapsible responsive control panel keeps the analytical tools accessible without obscuring the map on smaller screens.
Key Outcomes
The resulting application turns complex census data into an exploratory visual experience. Geographic patterns, regional differences, and demographic changes can be recognized directly on the map, while individual block groups can be inspected for precise underlying values.
Its modular filtering and visualization system also provides a reusable foundation for additional states, years, indicators, and geographic datasets. The same architecture can be adapted for market research, public planning, site selection, demographic reporting, and other location-based analysis scenarios.